Training a Neural Network in a Spreadsheet Application
Why Not Use Python?
Great question! The reason I'm doing this exercise is because I saw this in lecture 3 of course.fast.ai and I started wondering about my fundamental understanding of a neural network. I always thought that one needs to know a lot of calculus, statistics to even begin understanding its basic concepts but as you will see, that's not entirely true. We'll start with gathering our data.
Data
This part was simple because it was a very readily available, in-fact, famous dataset called the Titanic dataset from Kaggle. I downloaded the training dataset train.csv and imported it into LibreOffice Calc (yes, I'm a sucker for OSS)
Normalising The Data
Start by normalising the data
- Age: Divide by the maximum age
- Fare: I could have divided by the maximum fare but unlike age, the range is too much so some values may be relatively higher even after the fact. So I instead used the
LOG()function to have a fairly even distribution. Wish it was this easy in real life too - Other columns with less categories like ticket class, city where one embarked are represented using something called binary categorical variables. E.g. the ticket class can have three classes: first, second, and third class. If only the first class is represented in a separate column, assigning it a value of
1if a person bought a first class ticket and a0otherwise, then do the same for the second class, one can see that the categorical information present in one column has been extracted into two separate columns which have binary values
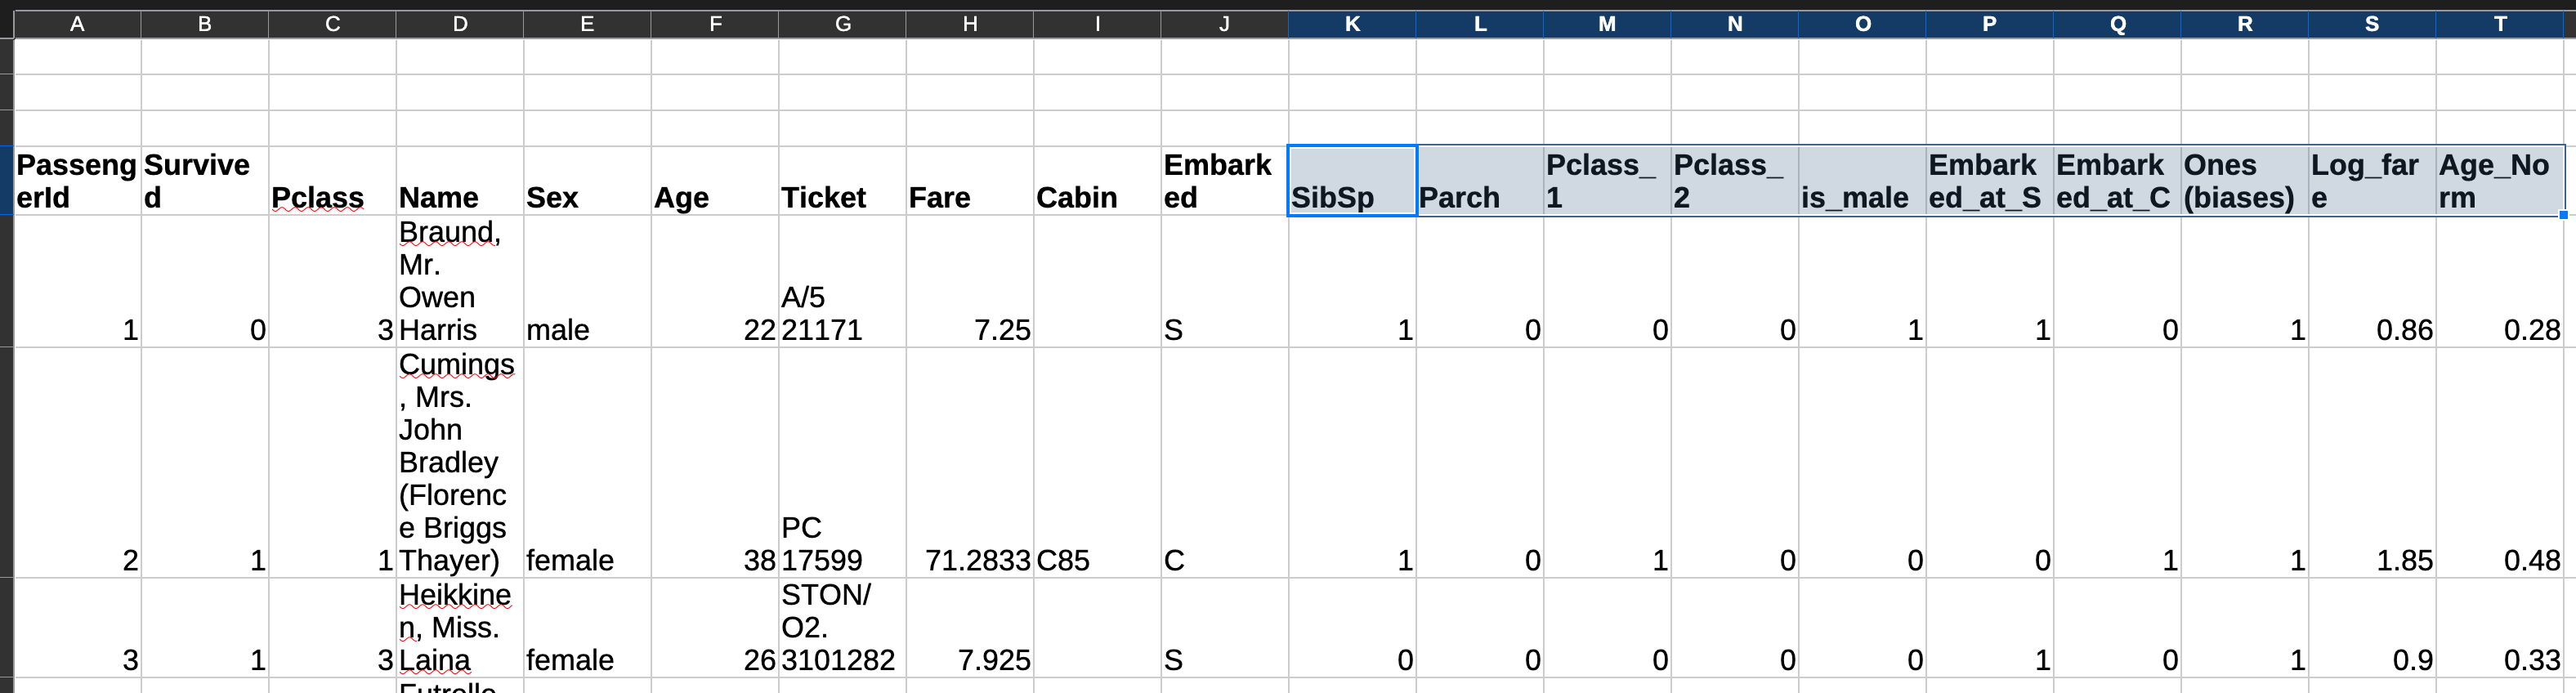
This is how it looks like after normalising the data — the highlighted columns will be used for training.
Models
I will be taking you through two different types of models. The first will be a regression model, followed by the neural network. Before jumping into this, let's discuss what exactly it is I am optimising for by defining some nomenclature
- Dependent variables:
SibSp,Parch,Pclass,Sex,Fare,Age— all of these will be considered in making a decision on if a person will survive or not - Independent variable:
Survived— what a model tries to predict - Parameters: Imagine a very intricate pulley system where you only have access to the ropes at the end. Pulling on any one of them, even by a very small amount, will have an effect at the end of the pulley system. These ropes are your parameters (initialised randomly in the beginning) and this is exactly what will be adjusted in multiple iterations to arrive at an optimum value, also called training. The final objective is that when they interact with each other and calculate a prediction, the accuracy is high and the loss is low
- Loss: A metric which helps the model in understanding how accurate it is. You want to minimise this
Regression
Initialisation
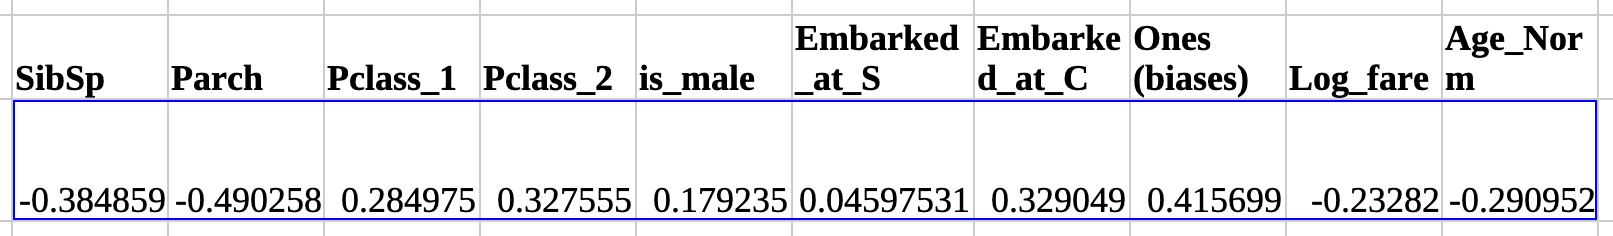
Start by initialising the dependent variables with random numbers, using the RAND() - 0.5 function.
Predictions & Loss
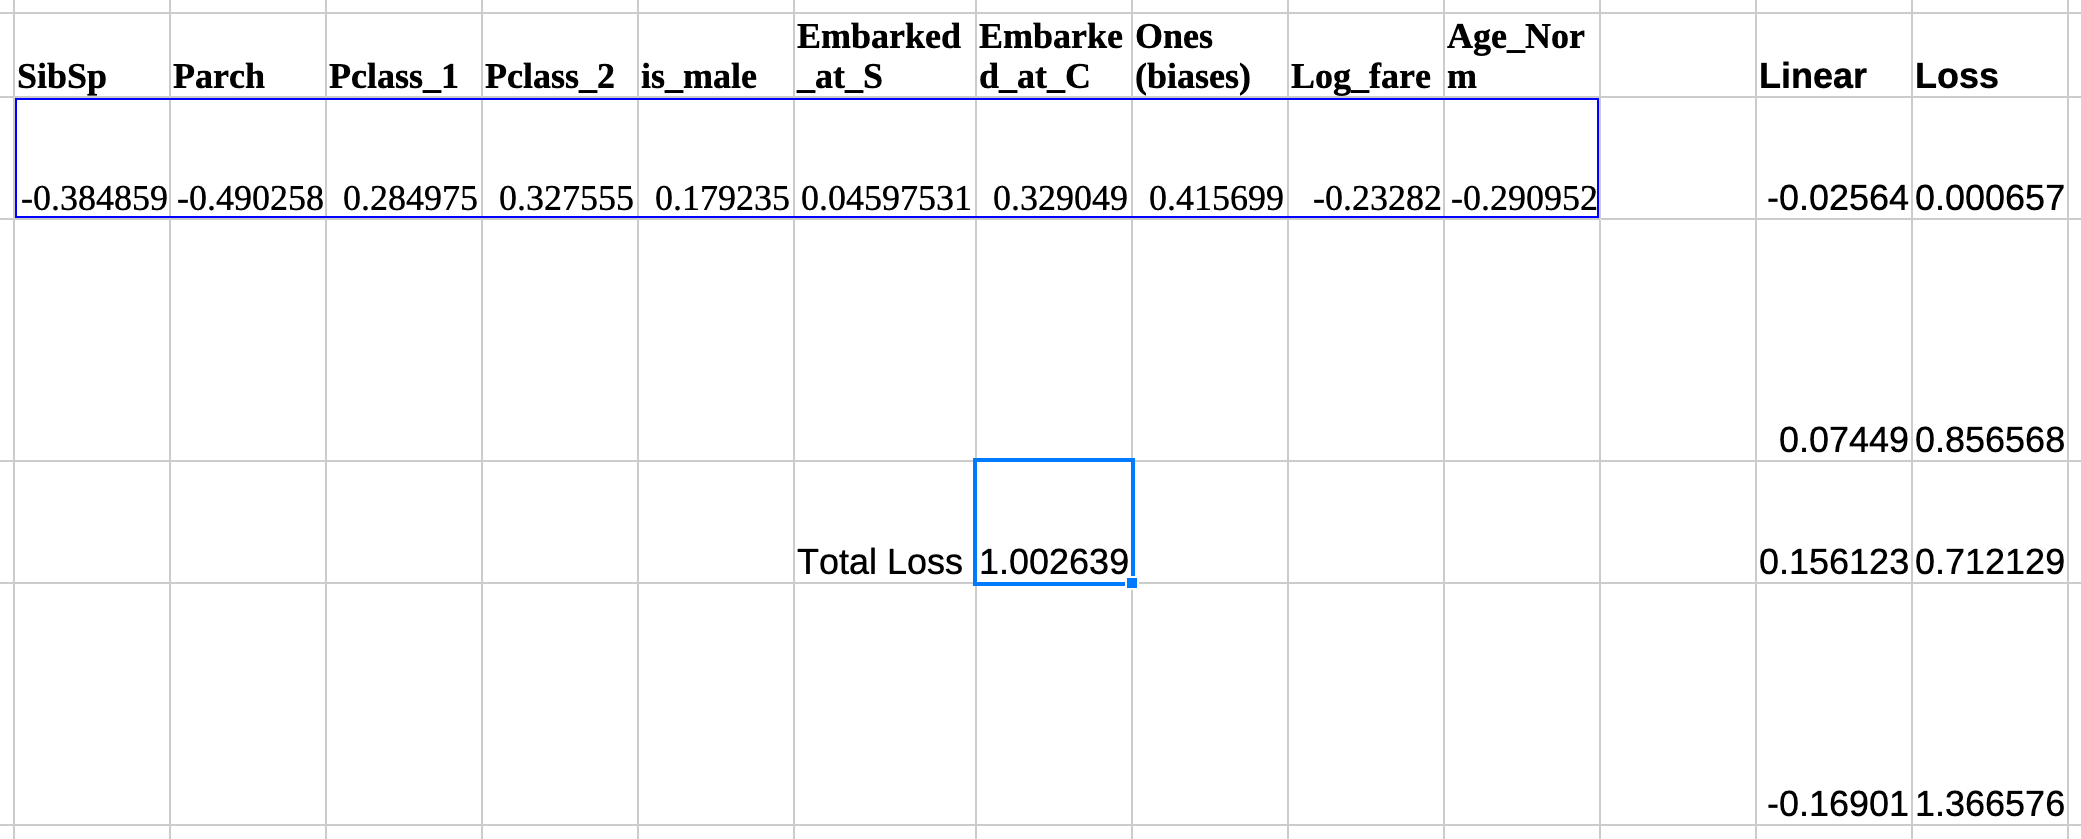
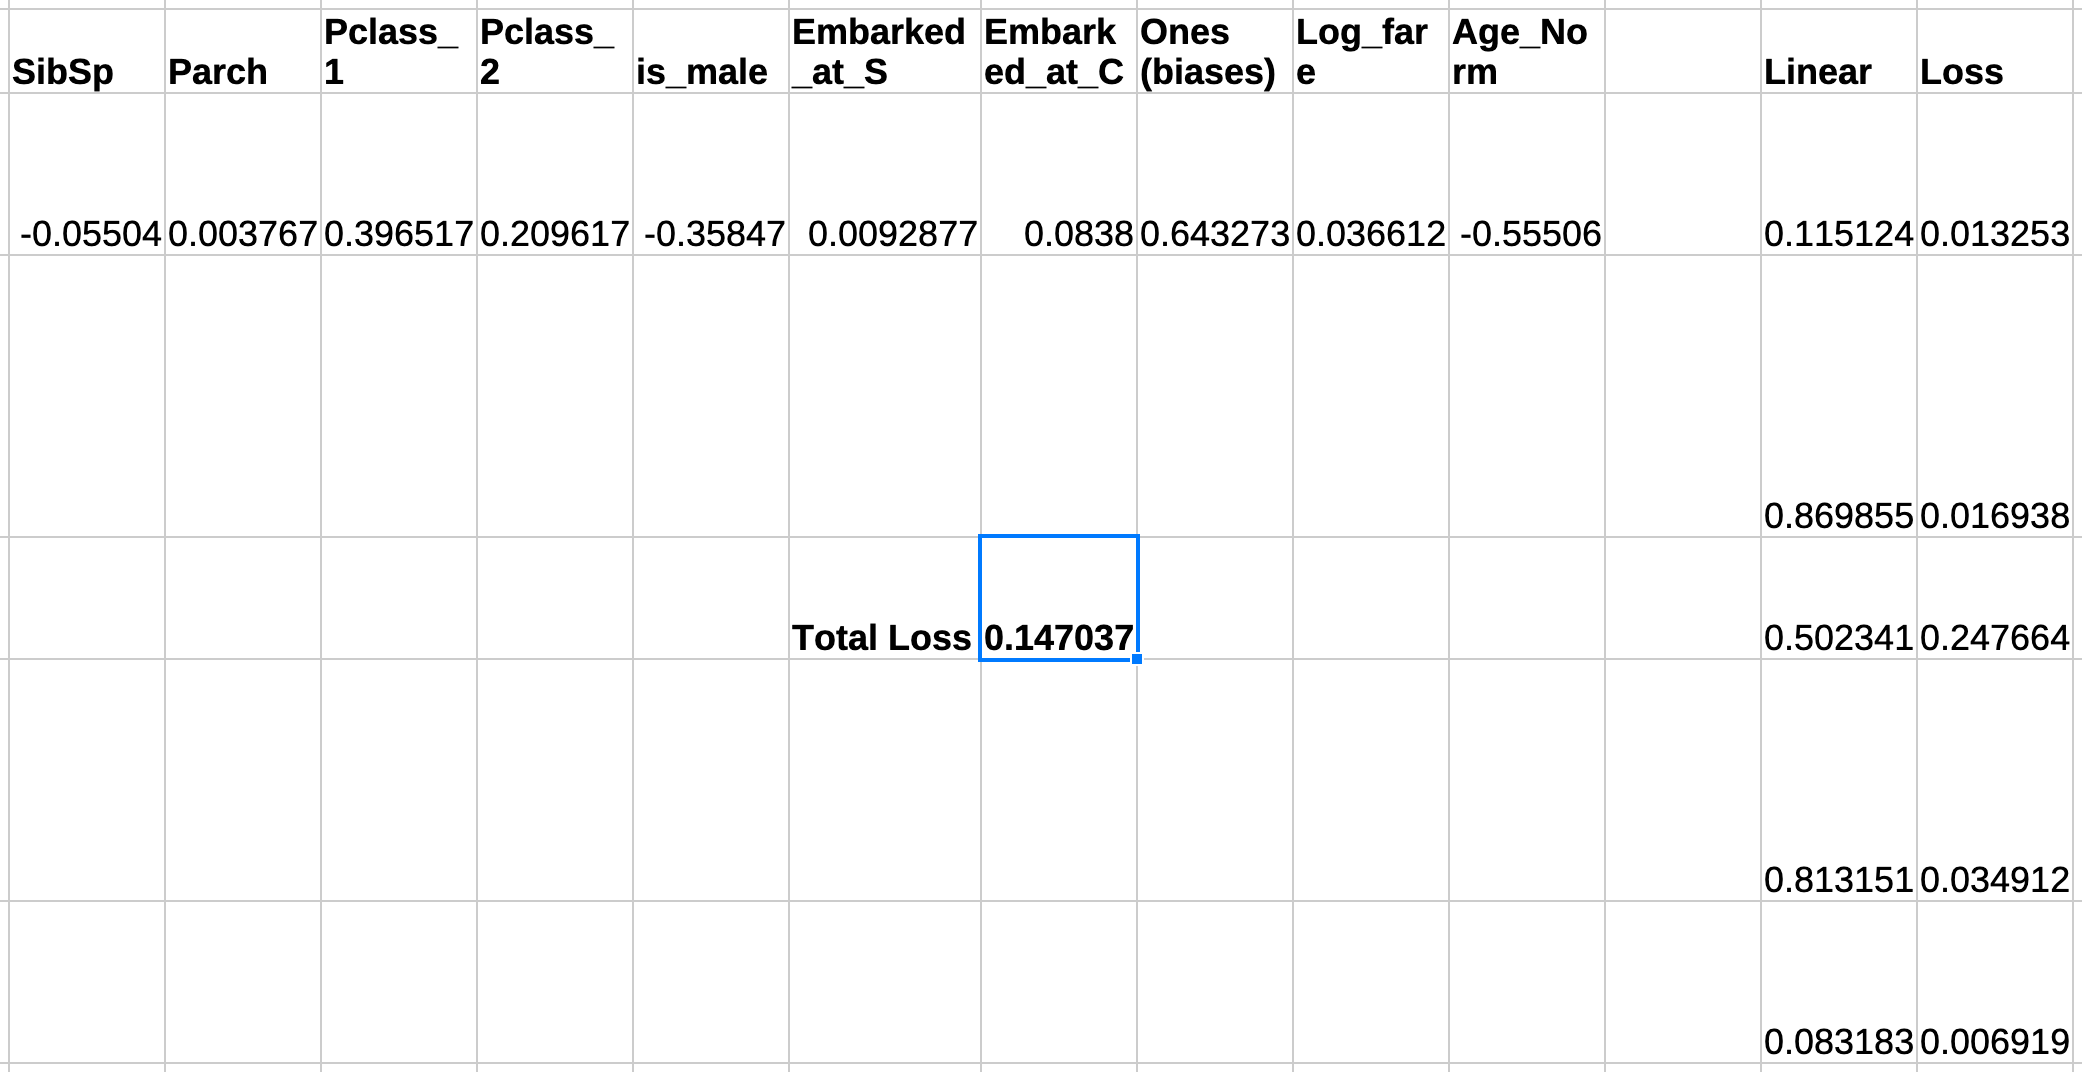
Multiply the value of these variables with the same rows from the data and add them up. Do this for each and every row. (SibSp [random] * Sibsp [data]) + (Parch [random] * Parch [data]). . so on. All spreadsheet application support this via the
SUMPRODUCT()function. These are our predictionsThe loss of each prediction is the difference between what was predicted and if the person actually survived, squared (known as Mean Squared Error). Total loss is just the average of all these individual losses. Putting that all together
Training
There is one caveat when training with LibreOffice Calc for both models, it doesn't have an exact equivalent of Microsoft Excel's GRG Nonlinear solver, so you will need to go into options and choose DEPS Evolutionary Algorithm. It does not use gradient descent but still gets the job done.
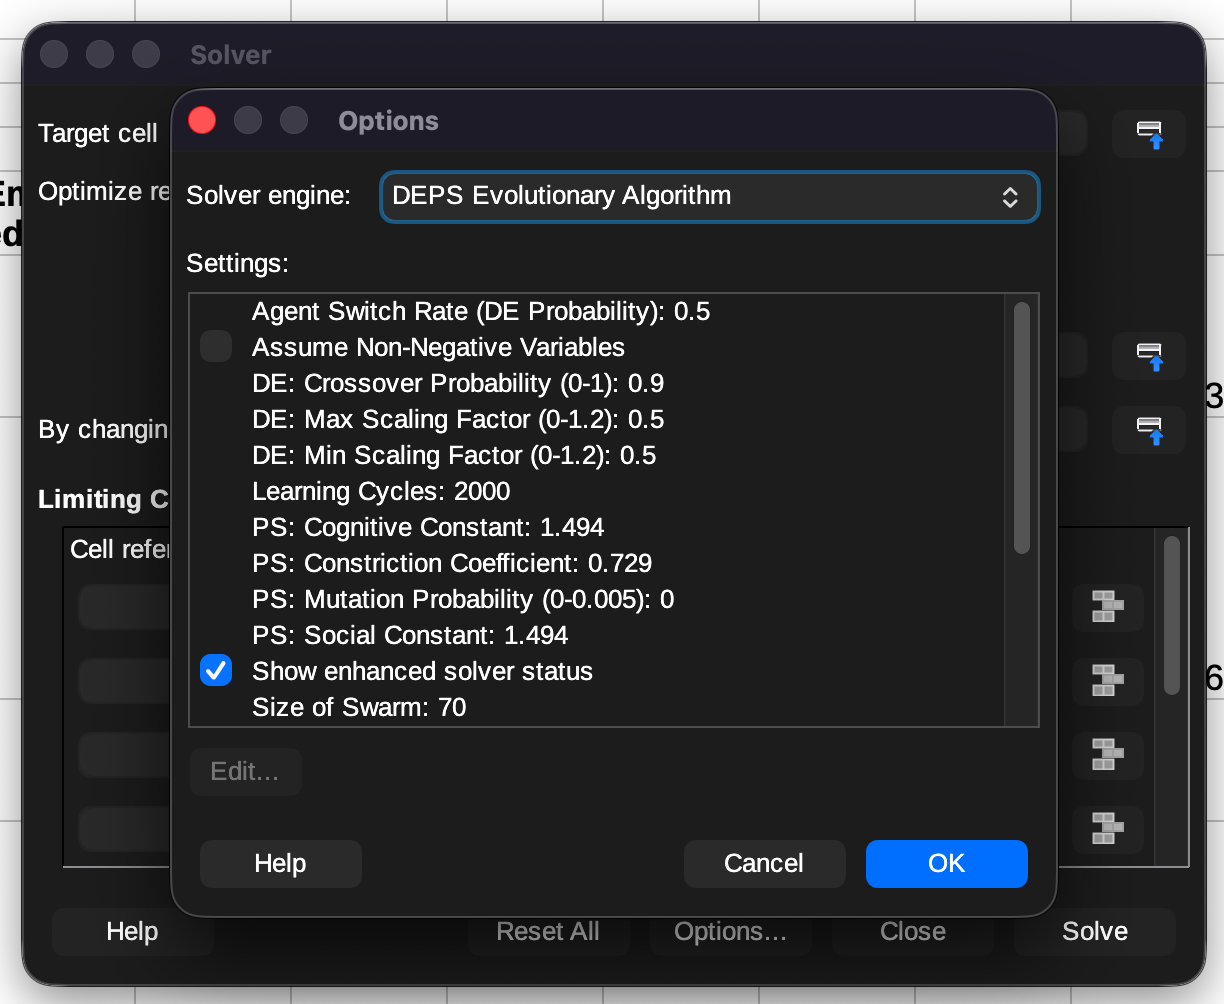
Using the solver, select the target which you would like to optimise, in this case it would be to minimise the loss, by adjusting the parameters. Then click on
Solve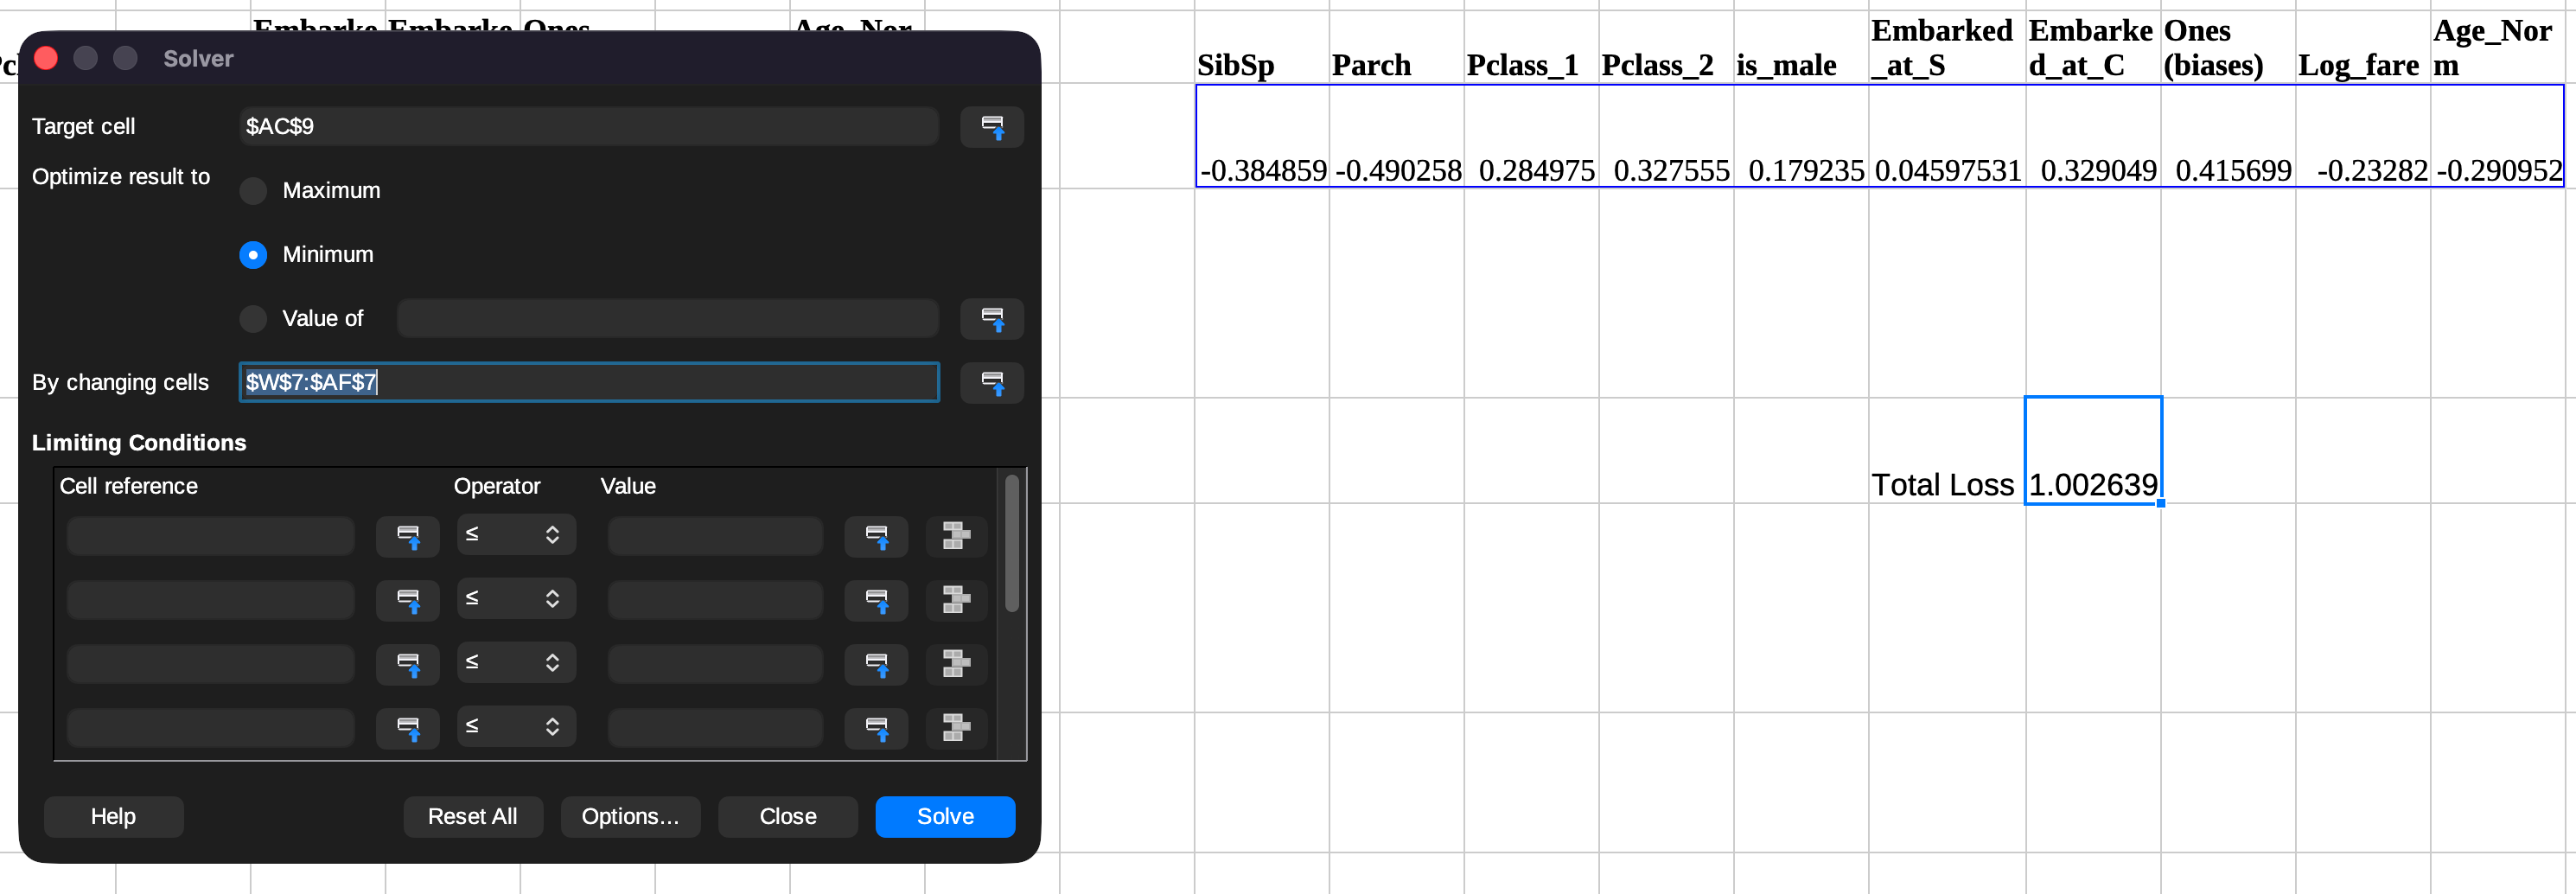
Since it's a different algorithm, it takes a little more time than traditional gradient descent to optimise. Took around a minute on an M4 Macbook Pro. Once it's trained, you can check how well it performed by looking at the loss column. E.g. if it predicted that the chances of a particular person surviving was above 80% and that person did end up surviving, that's a good prediction and vice-versa. Note that the total loss must be lower than what you started with, otherwise something has went wrong
Believe it or not, you have successfully optimised a solution to a problem in a spreadsheet! Onwards to training a neural network!
Neural network, Crux
Most of the initial steps to train a neural network are quite similar. The crux in neural networks is the non-linearity of them which allows them to learn intricacies. To introduce these non-linearities we use something called an activation function, in this case a Rectified Linear Unit (ReLU), a simple function — all positive values remain same while all negative values are clamped up to zero.
Predictions & Loss
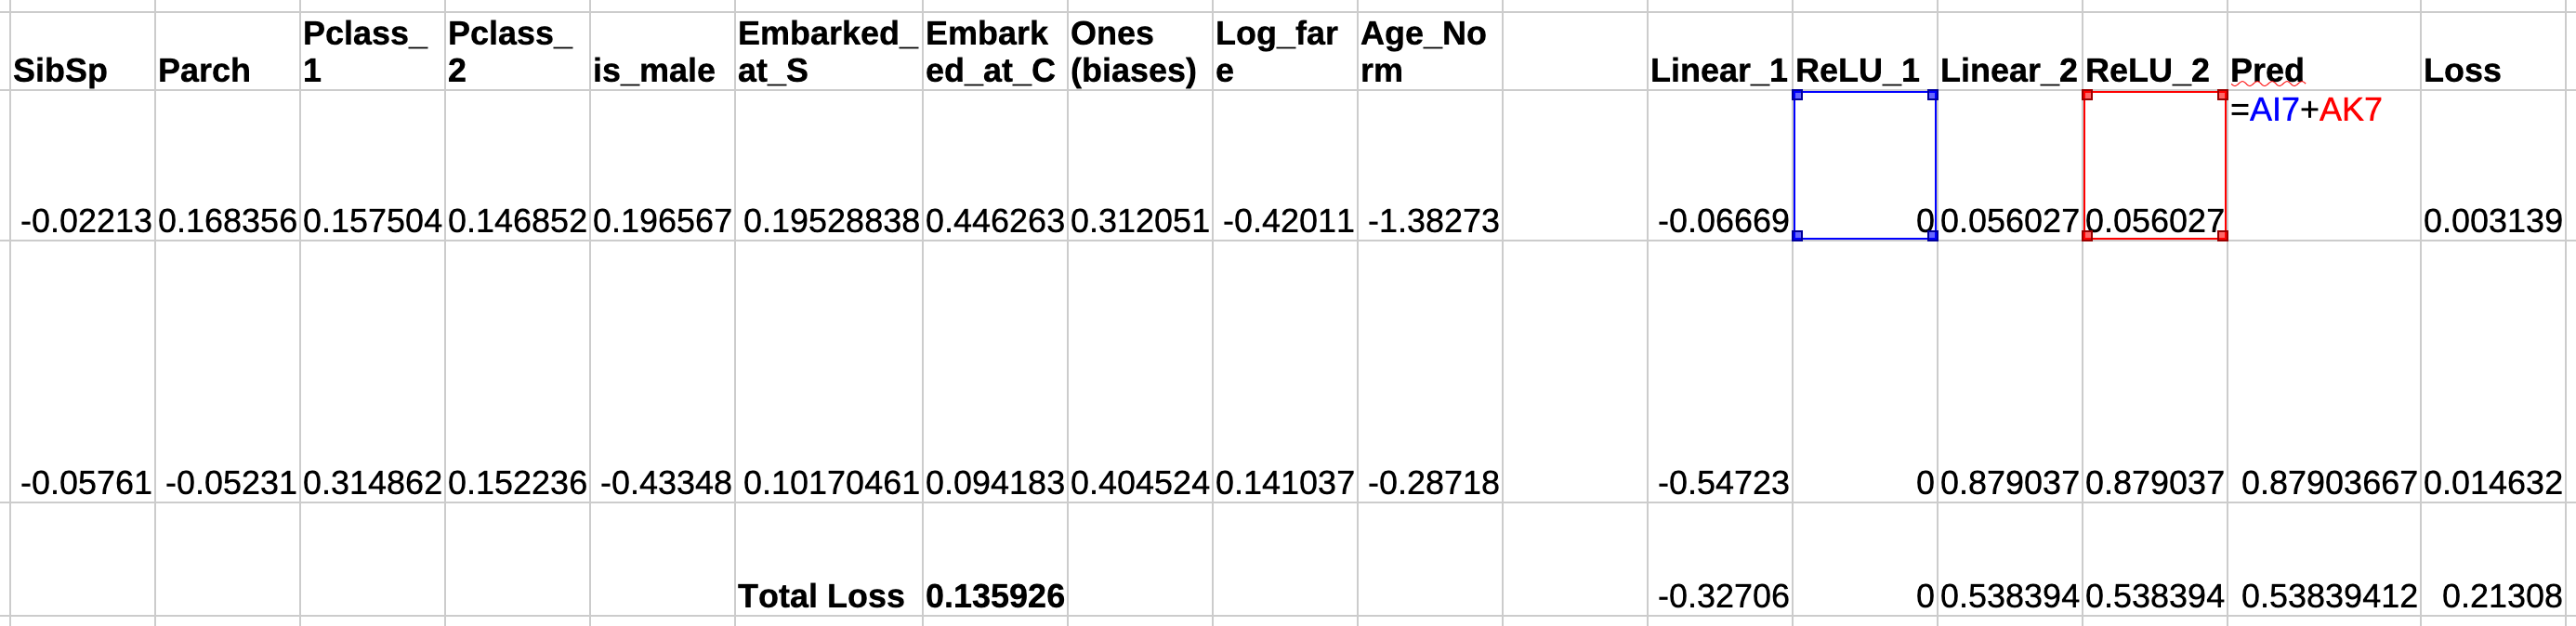
- I will now be using two layers of parameters instead of one. Why? A neural network's accuracy of prediction scales with the number of parameters (among a myriad of things) but that comes at the cost of training time, compute
- Two layers of parameters means that we will have two columns of predictions, and two columns of non-linearities computed on them. The final prediction is the sum of these two columns. You can figure out what the loss is. Ignore the value of the loss in the image below as the screenshot was taken post training
Training
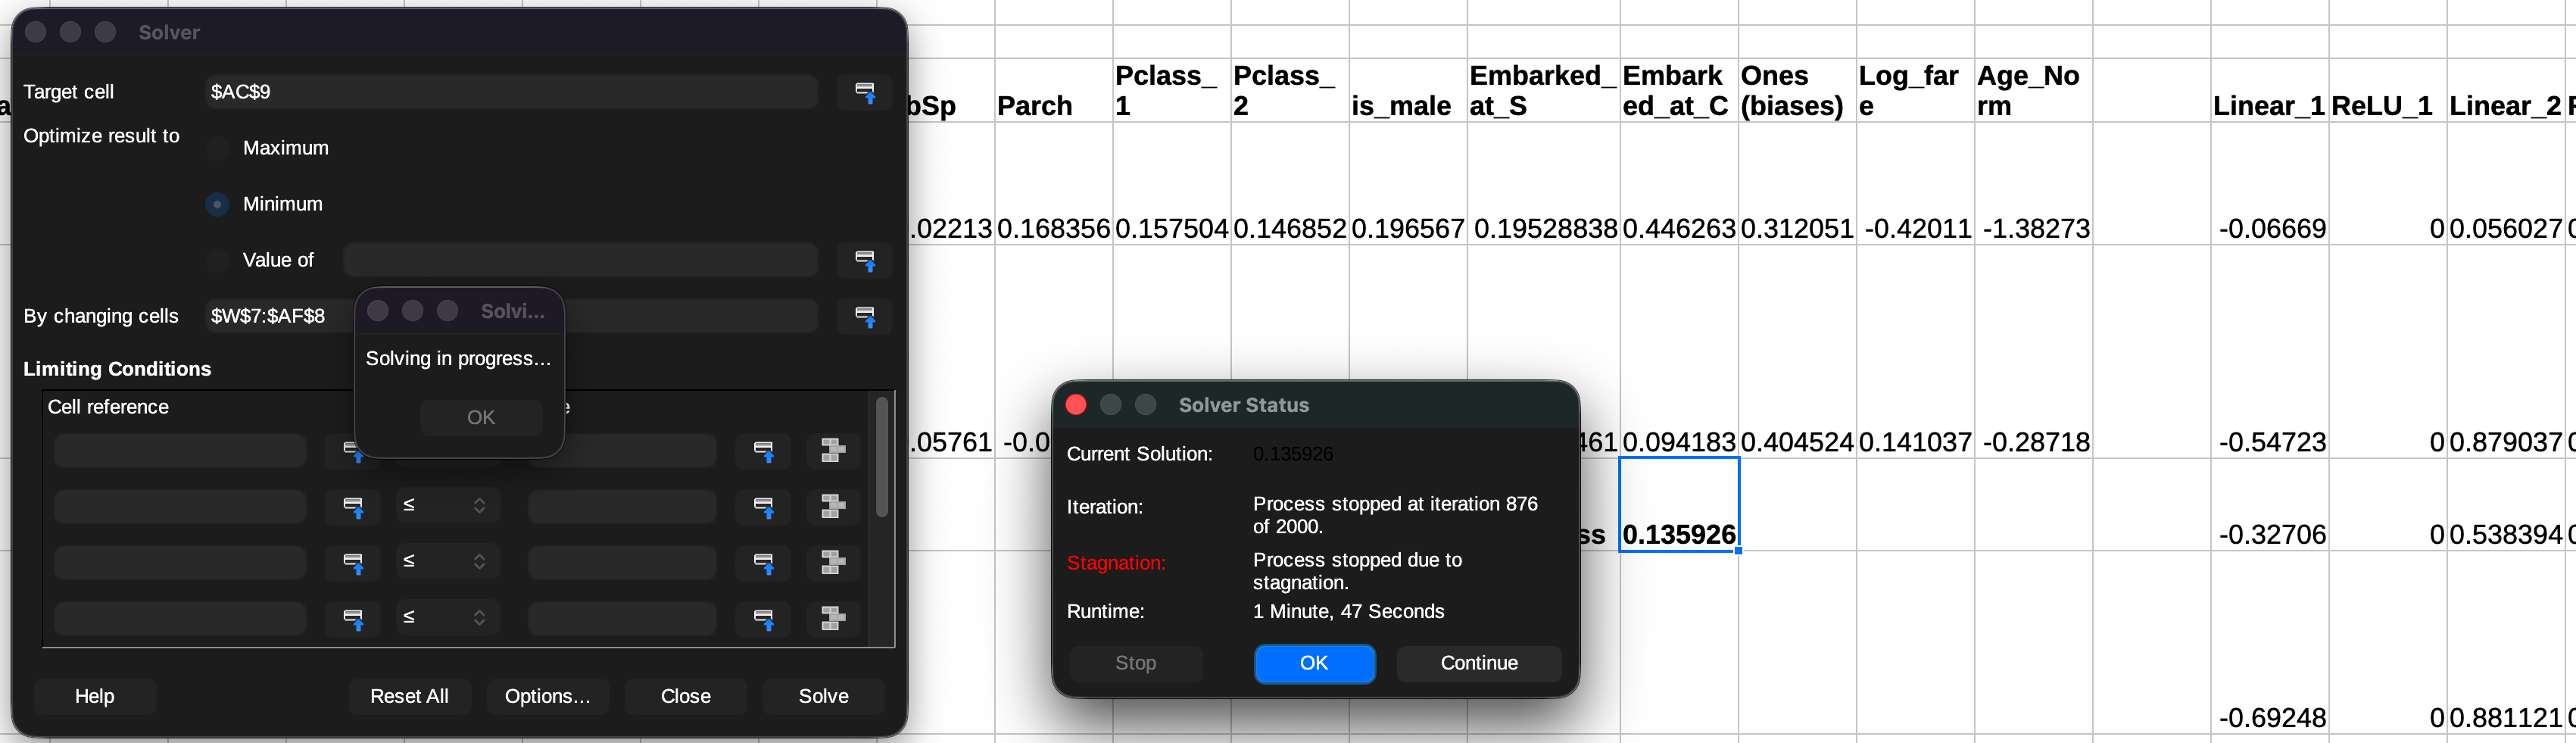
Use the same algorithm as before to train it and make sure that you select both the rows of parameters this time. Wait for ~2 mins (M4 MBP) and you have successfully trained your very own neural network in a spreadsheet!
Takeaways
Things worth noting:
- While the NN did take more time to train, it is also more accurate than the regressive model — by ~8% in this case
- How can I use this model to make new predictions? Easy — take any arbitrary value for the different parameters and perform the
SUMPRODUCT()operation on them to get a prediction. This is also called inference - The point of all this was to nurture a basic understanding of how all the fundamental parts of a neural network interact with each other. If you are still having problems grasping it, try thinking about why we need non-linearities at all
Also the next time you chat with ChatGPT or Claude, think about the huge number of parameters (couple trillion at this point) they were trained on and how they might be interacting with each other to produce the next token. On second thought, do that only if you have lots of free time.
Disclaimer
All of this was written by a 🧬, including the em-dashes.